


When we upgrade our homes, we want proof that those changes actually save us money. By data-logging our HVAC and shade usage, we can track energy patterns and finally see where we’re getting real ROI—no more guessing. This step gives us hard facts to back up our investments, whether it’s smart shades or high-efficiency heating and cooling.
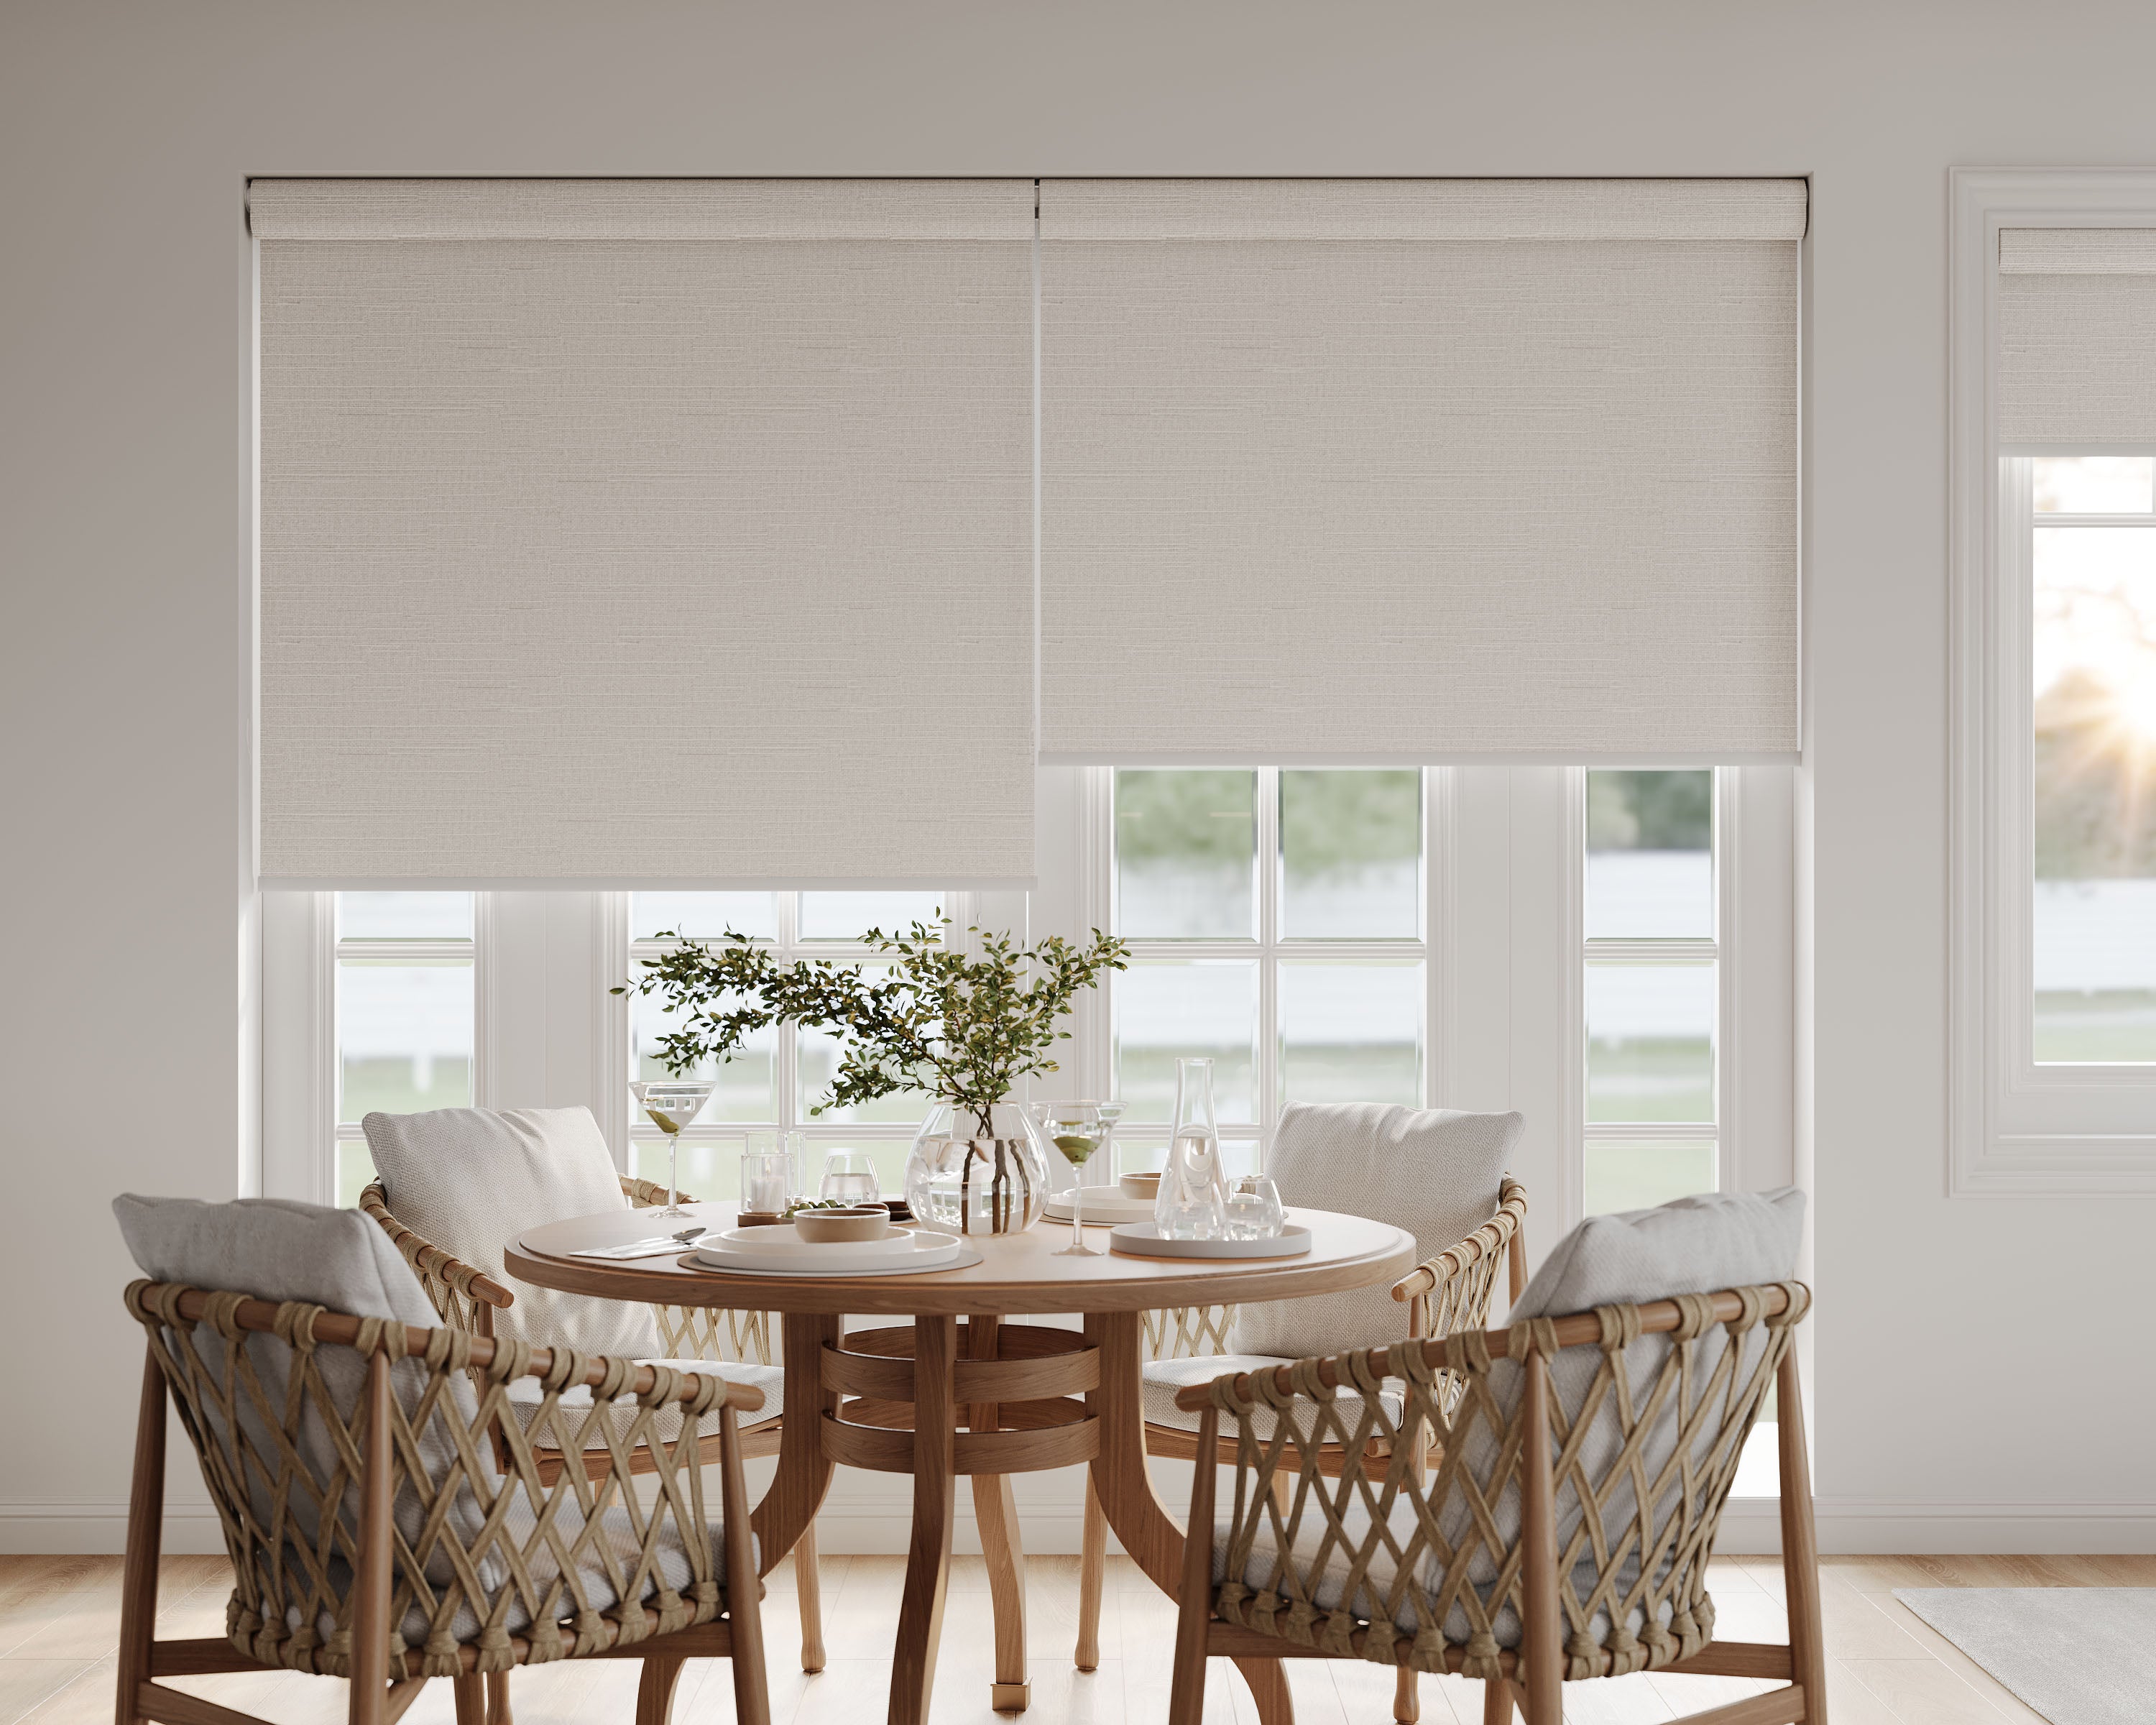
We don’t have to be tech experts to set up helpful data tracking at home. With a few good tools and some quick setup, we can start collecting the info that actually matters. Our future selves—and our wallets—will thank us for trusting real numbers instead of glossy sales pitches. For window treatments that seamlessly integrate with this data-driven approach, explore our collection of performance-tracking motorized shades.
Key Takeaways
- Data-logging shows how HVAC and shades affect energy use.
- The right tools make setup straightforward for most homeowners.
- Actual data gives proof of savings and helps spot problems early.
Why Data-Logging Your HVAC and Shade Usage Matters
Tracking our HVAC and shade usage with real data gives us a clear window into our home's efficiency. Numbers tell us what our comfort, energy bills, and daily habits can't always show.
Proof of ROI: Moving Beyond Gut Feelings
We all want to know that our investments in new thermostats, smart shades, or insulation upgrades pay off. Data-logging is how we go from "it feels cooler in here" to "we reduced runtime by 30 percent this month."
Instead of trusting instincts or hoping for a lower energy bill, we can point to hard numbers. It becomes easy to compare usage before and after a change, making it possible to track cost savings directly.
Here’s a quick breakdown of the kind of data we might collect:
| Action | Measured Impact |
|---|---|
| Install smart shades | Decrease HVAC runtime |
| Upgrade HVAC filter | Improved airflow |
| Adjust thermostat | Lower peak load |
With this data in hand, making future home improvements feels a lot less like guesswork and a lot more like investing with confidence.
Tangible Benefits for Homeowners
When we see our home's actual data, we spot exactly where the money goes. Want to know if shading the living room at noon really helps? The logs show us.
By reviewing trends, we can set our shades and HVAC to work only when needed, trimming energy use without giving up comfort. This not only saves money but also keeps our home feeling just the way we like it.
Automated logs take the effort out of tracking, so we spend less time fiddling with settings and more time enjoying the results.
Spotting Energy Inefficiencies Early
Small problems in our HVAC or shade routines rarely announce themselves with a neon sign. But when we watch the logs, it's obvious if our AC suddenly starts running longer, or if a shade stops closing in the afternoon.
Early detection gives us a head start on addressing leaks, broken actuators, or bad settings before we see a big spike in monthly costs. We can fix minor efficiency issues long before they snowball.
Regular data reviews help us stay in tune with how our home is performing. That way, little hiccups get our attention—and our fixes—before they become expensive surprises.
Choosing the Right Tools for Data Collection
Getting real ROI numbers means logging accurate data, integrating with what we already have, and making sense of it all without getting a headache. We want smart, compatible, and easy-to-use tools that fit into our homes and lives seamlessly.
Selecting Smart Sensors and Loggers
Not all sensors are created equal. For HVAC and shade tracking, we need smart temperature, humidity, occupancy, and light sensors. Wireless sensors are usually the way to go because they avoid the installation mess and blend in better.
Battery life matters, too. Nobody wants to change batteries every month, so we look for options promising at least 12 months of life. Accuracy is key: aim for sensors that log data to within 0.5°C for temperature and 5% for humidity. Popular brands include ecobee, Philips Hue, and Aqara for smart home integrations.
If we’re tracking window shade usage, door/window contact sensors double as shade position trackers. For the data logging itself, buying a dedicated logger—like a HOBO or a Shelly model—offers more detail and reliability than basic WiFi sensors.
Integration with Existing Home Systems
We don’t want another remote or app to juggle. Choosing hardware that plays nicely with our existing home automation hubs saves headaches down the line. Compatibility with platforms like Apple HomeKit, Google Home, SmartThings, or Home Assistant can be a dealbreaker.
Here’s a useful checklist:
- Works with our current hub or voice assistant
- Supports automation (for routines and schedules)
- Has open APIs or supports IFTTT/Zapier for future customizations
- Easy installation: most devices are “plug and play” or use peel-and-stick mounts
We should double-check network protocols. Some sensors use Zigbee or Z-Wave, while others are WiFi or even Bluetooth. Picking a standard already in our house means fewer “lost connection” issues and less troubleshooting. For a prime example of automation driven by external data, see how to use outdoor temperature sensors for automated shade control.
User-Friendly Data Platforms
Collecting data is only step one; reading it shouldn’t require a computer science degree. Platforms with clear dashboards, daily email summaries, and export options (CSV, Excel) are a big help.
Look for features like:
- Real-time graphs for HVAC runtime and shade position
- Historical trends so we spot those sneaky energy spikes
- Mobile apps so we can check stats from anywhere
Bonus points for systems that send us gentle reminders, like “Hey, your shades haven’t moved in 3 days!” The best platforms help us not just collect, but actually use our data to create real-world efficiencies.
Setting Up Your Data-Logging Workflow
Capturing accurate HVAC and shade usage data starts with choosing the right setup. The big wins come from sensor placement, structured data collection, and making sure our tracking stays dependable from day one.
Where to Install Sensors for Best Results
Mounting sensors in the right places makes a difference. For HVAC, we should put temperature and humidity sensors in both typically used rooms and out-of-the-way spaces like hallways. This helps show not just how our systems perform, but also where comfort drops off.
Light sensors for motorized shades go directly on the window frame or slightly above, where sunlight has the biggest impact. If we're using energy meters, plug them into the same outlets as HVAC controls or shade motors, not just general wall sockets.
We can use this simple table for reference:
| Sensor Type | Placement Location |
|---|---|
| Temp/Humidity | Living areas, bedrooms, hallways |
| Light | Top of window or window frame |
| Energy | Outlet for device/controller |
Avoid putting sensors near vents, electronics, or direct airflow to prevent skewed readings.
Scheduling Automated Data Captures
Logging at the wrong times wastes effort. We get the best insight when sensors log data at regular intervals, like every 5 to 15 minutes. This schedule spots daytime spikes or overnight cooling, without drowning us in excessive data points.
For shade usage, syncing smart shade logs with sunrise and sunset lets us track not just usage, but effectiveness in blocking heat. Most smart hubs let us set schedules for regular data exports. It's smart to automate backups, so we never lose a week of results because of a random glitch.
Setting reminders to manually check logs monthly adds a backup layer in case automations hiccup. We don’t want to discover blank logs after six months.
Ensuring Consistent and Reliable Tracking
Reliable tracking means we have to be a little vigilant. Double-checking sensor batteries or wiring keeps devices online. For Wi-Fi or Zigbee sensors, we should run a monthly connection test to spot dropouts early.
Some systems let us set up alerts for when a sensor goes offline or returns odd data. These are small details, but catching them saves us from big headaches later.
It also helps to keep a quick troubleshooting checklist:
- Replace batteries quarterly
- Restart central hub once a month
- Review for odd spikes or “flatline” data
- Update device firmware every few months
A little routine makes our logs dependable, so the data we rely on for ROI claims stands up.
Analyzing HVAC and Shade Data for Real Insights
Once we've gathered a solid batch of data from our HVAC systems and window shades, it’s time to dig into the numbers. Practical analysis lets us figure out exactly where energy (and money) are going, and helps us tweak our setup for even smarter results.
Key Metrics to Watch
For HVAC usage, the must-watch metrics include daily runtime (in hours), temperature setpoints, and the frequency of on-off cycles. It’s also smart to track indoor temperature swings and how often shades are opened or closed compared to solar gain throughout the day.
A simple table can help keep things organized:
| Metric | Description | Why It Matters |
|---|---|---|
| HVAC Runtime | Hours system is active | Shows energy demand |
| Shade Operation | Number of adjustments daily | Gauges occupant habits |
| Indoor Temperature | Degree fluctuations | Comfort & efficiency |
| Outdoor Solar Gain | Sun exposure hours | Impacts cooling need |
By keeping tabs on these, we spot clear connections between our behaviors and the system’s performance. This is where we start to see if running shades strategically actually shifts the needle on our electricity bills.
Spotting Trends Over Time
Looking at the data week over week (or month over month) reveals patterns our memory cannot. For example, we might notice peak HVAC usage every afternoon, right when sunlight streams through west-facing windows. Sudden spikes often line up with heatwaves or forgotten closed shades.
To keep it easy, let’s use graphs or simple line charts. Focus on how indoor temps react to repeated shade adjustments. Also, note any reductions in HVAC use that seem to follow shade tweaks, especially during sunny stretches.
Small, regular logs tell us whether last week’s experiment—maybe lowering the blinds two hours earlier—made an actual dent in our cooling costs. It’s rewarding when a little button push shows up as real savings.
Comparing Before-and-After Scenarios
We get the clearest ROI picture by comparing data from before and after making changes. For instance, record HVAC runtime for two weeks with no shade use, then two weeks with shades managed throughout the day. Plug the results into a quick summary table:
| Period | HVAC Runtime (hrs) | Shade Adjustments | Average Temp | Notes |
|---|---|---|---|---|
| Before | 36 | 2 | 75°F | Manual only |
| After | 24 | 10 | 74°F | Scheduled use |
To build a proactive schedule from your findings, learn how smart scheduling for energy savings automates shades based on the sun's daily path.
Fewer runtime hours usually mean lower bills, provided comfort levels stay steady. Even small drops are worth celebrating. These before-and-after numbers not only help us justify our latest gadget but give us proof when convincing skeptical family members or neighbors.
Demonstrating ROI with Real-World Examples
With reliable data, we can see more than just numbers—we can track meaningful savings, personal comfort, and real outcomes in our homes. By examining real results, we identify what actually works instead of relying on guesswork or wishful thinking.
Showcasing Reduced Energy Bills
One of the clearest ways to prove return on investment is by comparing our energy bills before and after making changes to HVAC schedules and automated shades. For example:
| Month | Old Bill ($) | New Bill ($) | Savings ($) |
|---|---|---|---|
| January | 180 | 155 | 25 |
| February | 165 | 145 | 20 |
| March | 158 | 133 | 25 |
By keeping a simple spreadsheet like this, we visually track our monthly savings. When we add up our results over several months, the value of new automation becomes undeniable. Every dollar saved is more money for better throw pillows (or maybe just the electric bill).
Highlighting Comfort Improvements
It’s not just about saving money—comfort counts, too. With smart thermostats and shade controls, we can log temperature, humidity, and light levels in different rooms.
After setting up automated shading, plenty of us notice rooms stay cooler in the afternoons. Automated HVAC helps cut down on cold drafts or those stifling hot spots. Some folks even run a quick poll with family or jot down “comfy/uncomfy” notes to keep things honest.
A simple scale works well for tracking comfort:
- 1 = Always uncomfortable
- 3 = Sometimes uncomfortable
- 5 = Always comfortable
By tracking comfort over time, we get a clearer picture than just relying on gut feelings.
Sharing Visualization Dashboards
Graphs often say more than words, especially when we want to show off our data. With dashboards from tools like Home Assistant, it’s easy to turn all those numbers into visuals.
Bar graphs show hour-by-hour energy use. Line charts make it easy to spot temperature swings. Pie charts break down how much energy goes to heating, cooling, or other stuff.
Some favorites to share:
- Before-and-after temperature graphs
- Animated timelines of shade positions
- Monthly electric costs, color-coded
We might share screenshots with friends or just enjoy the proof ourselves. Colorful dashboards make the whole project feel more real—and, honestly, they’re a bit of a flex at dinner parties. To expand your data-driven automation further, consider integrating smart shades with your home's lighting and thermostat for whole-home comfort.
Addressing Privacy and Data Security
When we log HVAC and shade activity, we’re turning our homes’ private moments into digital records. Keeping this info safe means understanding privacy risks and picking platforms with security in mind.
Keeping Your Home Data Safe
We’re all for tech upgrades, but nobody wants their home life broadcasted. Securing logging devices usually starts with strong Wi-Fi passwords and keeping firmware up to date.
Some smart steps:
- Change default logins
- Turn on multi-factor authentication if it’s there
- Update device software regularly
- Disable unused features or cloud sharing
Where we place devices matters, too. Hubs and sensors should be somewhere secure—not out where guests might reset or mess with them.
A basic home data security checklist could look like this:
| Task | Frequency |
|---|---|
| Change passwords | Every 3-6 months |
| Update firmware | Monthly |
| Check access logs | Monthly |
A little paranoia isn’t a bad thing. If something seems off in the logs, it’s worth digging in.
Choosing Platforms with Solid Security
Not every data-logging platform handles our info the same way. We should look for platforms with transparent privacy policies, real encryption, and a good track record—don’t be afraid to ask direct questions or read the fine print.
Key features to look for:
- End-to-end encryption
- No data sharing without clear consent
- Regular independent security audits
Pro tip: Always check what’s collected and stored in the cloud. The best tools let us minimize what’s kept, or even keep everything local.
If a platform’s security FAQ feels vague, that’s a warning sign. We shouldn’t settle when it comes to privacy at home. Good vendors explain how they store and protect our info in plain language—no runaround.
Maintenance and Regular Data Review
Keeping our data-logging system accurate takes a bit of effort, but it’s worth it. Routine checks help us catch small issues early and spot trends that actually impact comfort and energy bills.
Calibrating and Updating Devices
Our sensors and loggers are only useful if they’re calibrated right. If a temperature or light sensor drifts out of spec, we can end up chasing the wrong problems. Check device manuals for how often to recalibrate—some just need a yearly reset, others more often.
Here’s a quick checklist:
- Check batteries or power every month.
- Recalibrate sensors as the manual suggests.
- Update firmware when new fixes or features pop up.
Many platforms send update or maintenance reminders. If we ignore those, we risk collecting junk data, so it’s worth paying attention to pop-ups and emails. Staying on top of this keeps our data reliable.
Making Sense of Your Ongoing Data
Collecting numbers is just step one. We need to review our data regularly—weekly or monthly works for most. Comparing trends in temperature, system run-times, and shade adjustments lets us spot patterns that point to inefficiencies or missed savings.
What to watch for:
- Sudden spikes in HVAC use might mean a window or door is open.
- Shade movements that don’t match sun hours could mean a programming slip.
- Consistent outliers usually mean a sensor’s gone bad or been bumped.
If your data reveals unexplained gaps or spikes, our guide to troubleshooting smart shade connectivity can help diagnose common issues.
Most of us find it easiest to use app dashboards or export data to a spreadsheet for a closer look. Even if we’re not data nerds, a simple line graph or average can reveal a lot. The point is to catch small problems before they grow and tweak things as seasons change.
Troubleshooting Common Problems
When we start logging HVAC and shade usage, things don’t always run smoothly. Before stressing out, it’s usually best to check the basics.
Frequent Issues and Quick Fixes:
- Sensors not reporting: Double-check power and Wi-Fi. Dead batteries or a dropped connection are often the cause.
- Data gaps or weird readings: A loose wire or a poorly placed sensor can throw things off. Reseating a sensor is simple and can work wonders.
- Integration hiccups: Mixing smart shades with HVAC can get tricky. Make sure everything’s on the same network and firmware is up to date.
If dashboards show blank screens or odd charts, this quick table might help:
| Problem | Possible Cause | What We Can Do |
|---|---|---|
| No data in app | Bad Wi-Fi, dead sensor | Reset router, replace batteries |
| Temperature spikes | Sun hits sensor directly | Move sensor, shade window |
| Missing HVAC cycles | Schedule misaligned | Adjust schedule, resync devices |
Firmware updates sometimes mess with settings, too. It’s smart to keep backup copies of your setup or snap screenshots before hitting “update.”
If hardware just won’t cooperate, reaching out to manufacturer support or checking forums can save the day. Odds are, someone else has had the same issue—and maybe even a laugh about it.
Explore Smart Shades by Style


Frequently Asked Questions
Using data loggers with our HVAC and shade systems lets us see what’s working, spot wasted energy, and back up efficiency claims with our own real numbers. Tracking weather and shading often means we can make easy changes that quickly show up on our bills.
How can integrating a data logger improve the efficiency of an HVAC system?
A data logger records when our HVAC runs, how hard it’s working, and indoor temperatures through the day. This helps us recognize if the system’s cycling too often, or running when we don’t need it.
With this info, we can fine-tune settings or spot issues to avoid wasted energy and unnecessary repairs.
In what ways does monitoring shade patterns affect energy savings at home?
If we track when sunlight hits our space, we know when rooms warm up and when to close blinds or open shades. Timing shades properly can reduce HVAC use, since our systems don’t have to fight unwanted heat gain or loss.
This targeted shading keeps rooms comfortable without always relying on the thermostat.
Can data logging provide concrete evidence for energy cost reduction?
Yes. Data loggers let us compare actual energy use before and after we try a new setup, like moving shade schedules or adjusting thermostat times. The record shows real changes in HVAC runtime or electricity use.
These numbers can be matched to our utility bills for actual proof of savings.
What are some practical tips for setting up a home HVAC data logging system?
Start simple by placing loggers near vents or thermostats where we’ll capture real room conditions. Use smart plugs or sensors to log when equipment runs.
We should label the loggers by room and keep notes on changes we make, so we can link our actions to the results in the data.
How does weather monitoring through data logging contribute to smarter HVAC usage?
By logging outdoor temperature and humidity, we see how weather actually affects our comfort and HVAC use. On moderate days, we might realize we can use more natural ventilation instead.
Knowing the patterns helps us anticipate and adjust, instead of reacting to surprises.
What’s the real difference in savings when I optimize my HVAC based on data logging insights?
People often notice that small tweaks—like shifting thermostat schedules or letting shades do their thing automatically—can cut energy use by 5 to 15 percent. Of course, it all depends on your house and how you live in it, but you’ll usually spot the difference once you start tracking what’s really going on.
Sometimes, you realize you’ve been heating or cooling an empty house for hours, and you wouldn’t even know unless the numbers pointed it out. Funny how the data can call you out like that. For a detailed, long-term perspective on your investment, read our five-year cost-benefit analysis comparing motorized and manual window shades for the average homeowner.
